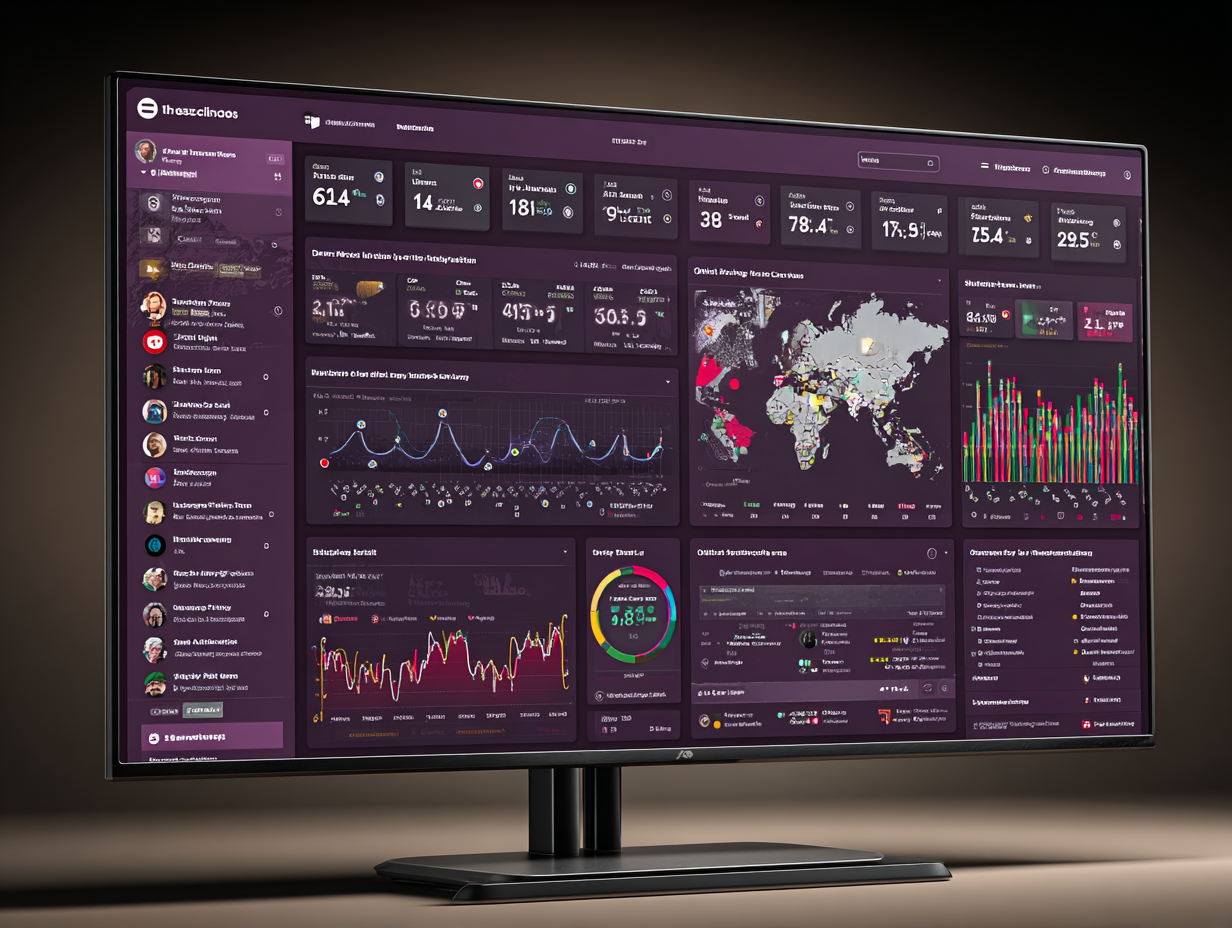
Dashboards
Today, the client's team quickly responds to market changes, forms a strategy based on analytical dashboards.
TelegramAPI
We developed a comprehensive analytics system that collects, processes and displays key market metrics in real time.
Today, the client's team quickly responds to market changes, forms a strategy based on analytical dashboards.
The system automatically cleans, normalizes and aggregates data
The system automatically updates, sends notifications about key market changes, generates forecasts and seasonal trends.
A design was created for the site from scratch. The customer provided us with a logo and brand colors, from which we started when selecting design solutions. Thus, a full-fledged design system was created, as well as prototypes and page frames that were transferred to development.
Grafana is integrated with PostgreSQL which ensures high performance even with large volumes.
Case Study
The real estate market has thousands of transactions. Hundreds of offers. Dozens of factors: prices, locations, housing types, demand by district, seasonality, competition.
And at the same time — analytical chaos reigns almost everywhere: Data is scattered across tables, reports, chats and analysts' heads. Decisions are made by eye. Trends are noticed when it's too late.
A client approached us — with a task: to create a unified system that would not only collect data, but also tell — what is happening in the market, here and now.
We didn't build another dashboard panel. We built a live market monitoring system.
We developed a central database into which we integrated: Official statistics, Client's internal data, Geodata and metrics by district. Then the data underwent cleaning, normalization and aggregation — using automated ETL processes.
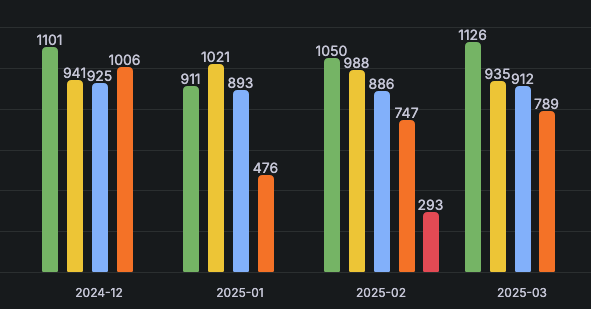
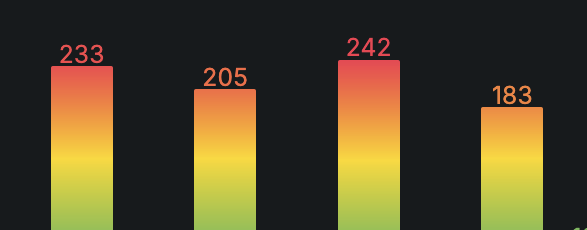
We chose Grafana — not just as a visualization tool, but as a platform for operational analytics. We developed a set of dashboards:
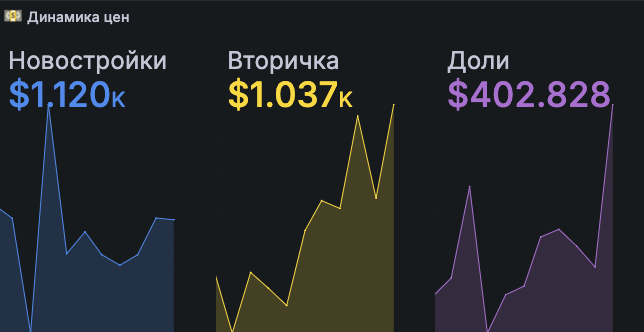
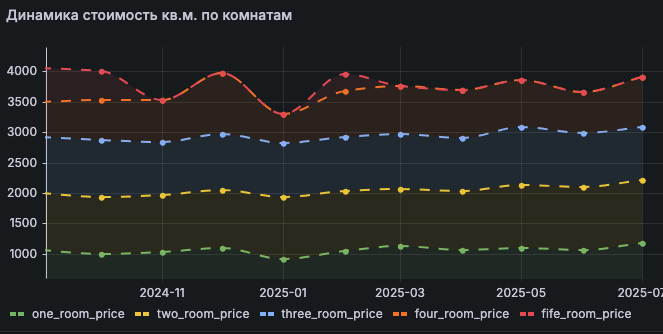
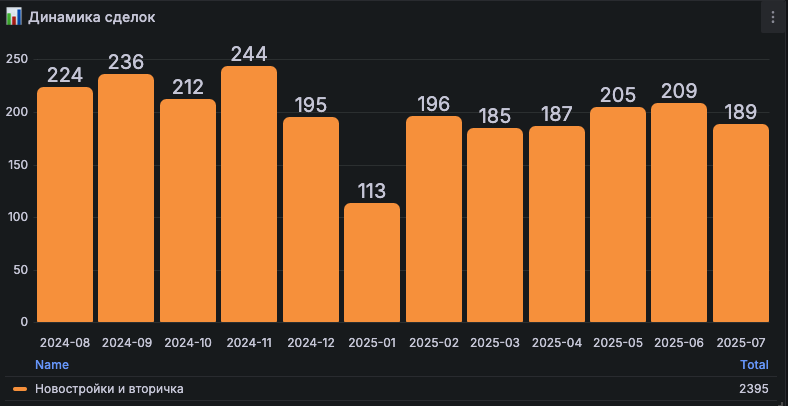
Price dynamics by cities and districts — broken down by housing type (secondary, new buildings) and much more. You can zoom in time, filter by object type, compare periods.
Previously, generating a report took a day. Now — real-time updates. Where there used to be guesses — now accuracy, speed and control.

Hi! I'm Valery, your personal manager. Give me 2 minutes and I'll show you how quickly, reliably and without unnecessary hassle to automate and accelerate your business.