Map Visualization
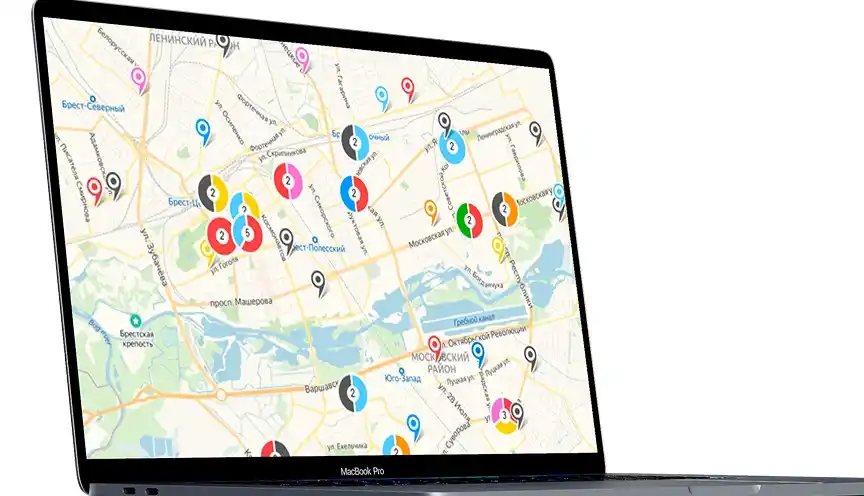
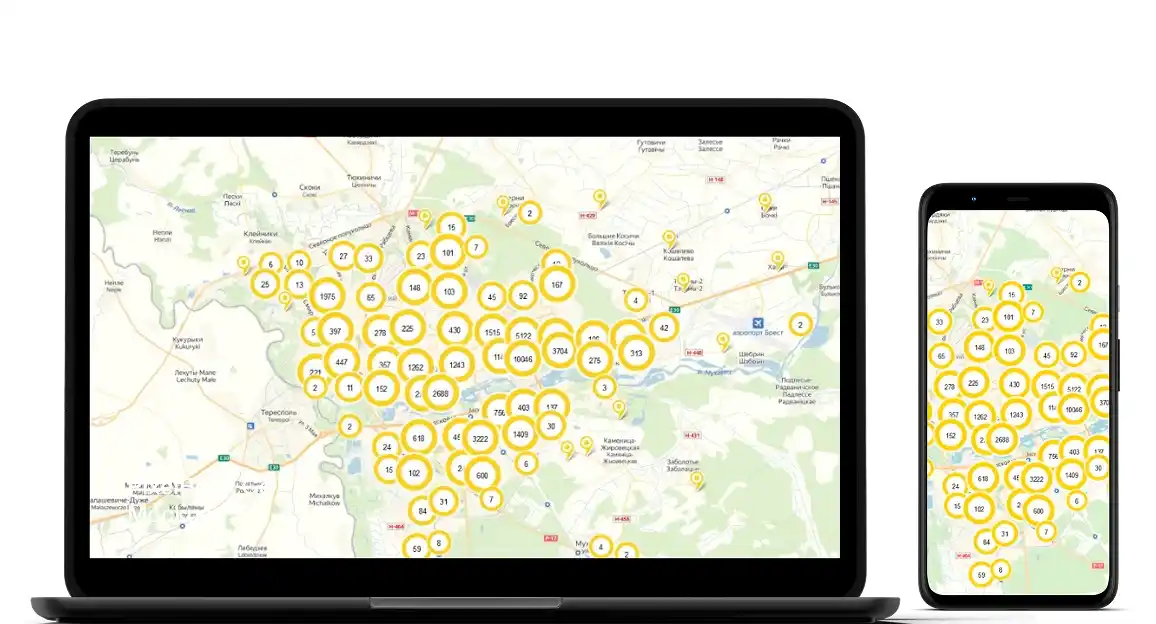
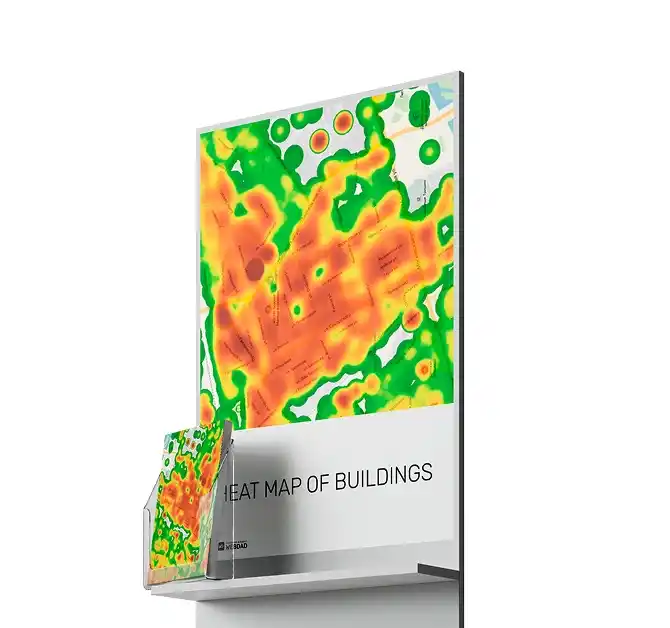
We implemented a scalable map with support for zooming, layer overlay, coverage zones and heat maps of population density.
MapGeovisualization System
We combined data from hundreds of sources: cadastre, registries, open APIs, field research. Cleaned, normalized and linked to geocoordinates — for the first time creating a comprehensive map of real estate and households.
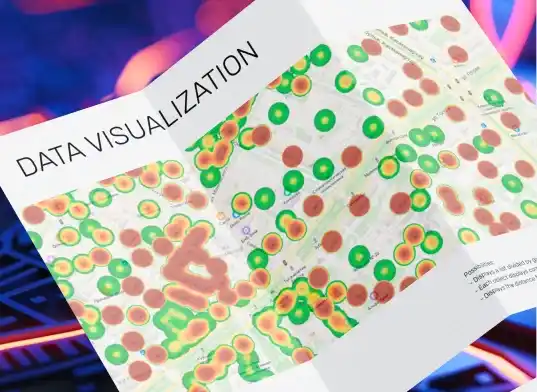
We implemented a scalable map with support for zooming, layer overlay, coverage zones and heat maps of population density.
We combined data from hundreds of sources, normalized and linked to geocoordinates.
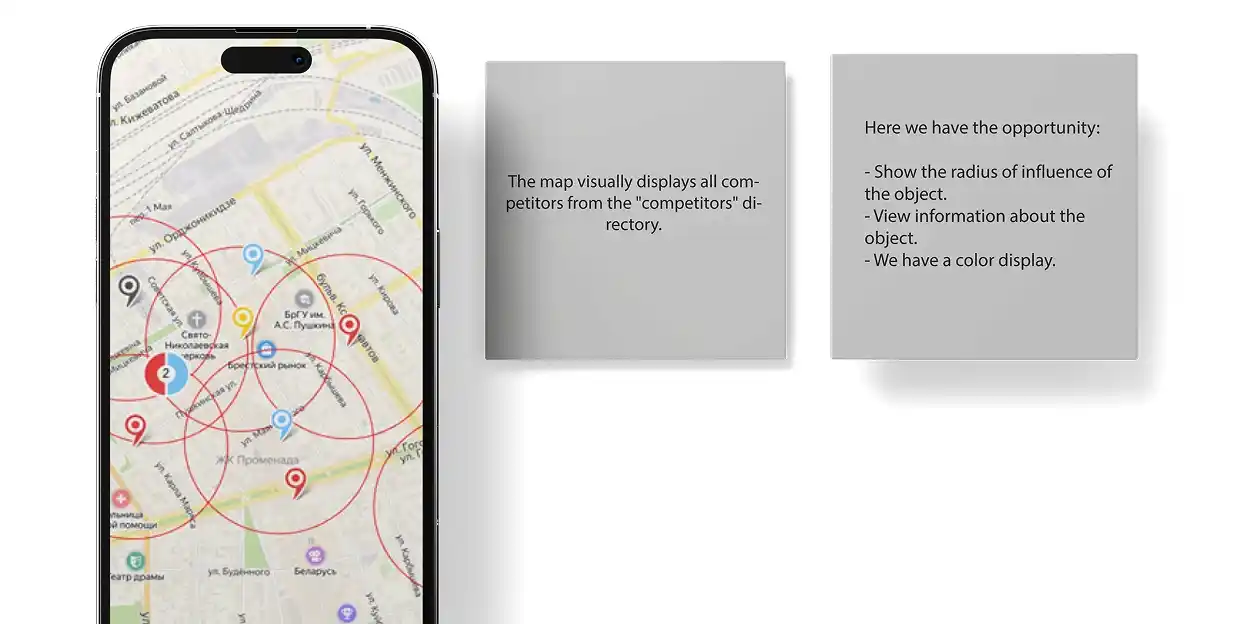
Added the ability to mark points of competing stores with indication of format, area and approximate turnover — to see the whole picture.
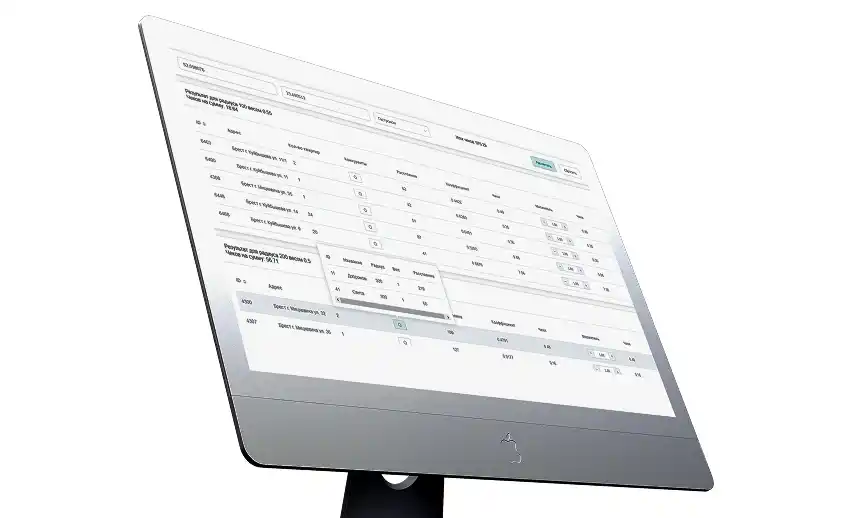
We developed an algorithm that, based on data on population, income, transport accessibility and competition, calculates potential revenue for each location.
Real-time analytics implemented: conversion from view to request, most popular objects, effectiveness of marketing campaigns and much more.
Case Study
Once a large retailer approached us. Not with a request 'make a website' or 'launch advertising'. But with a question on which millions depend: 'We want to open a new store. But where? Where are the people? Where are there no competitors? Where are they ready to spend? And how to measure it at all?'
We are used to digital tasks. But here is the physical world. Streets. Houses. Apartments. People that no one kept track of.
And we faced a strange, almost crazy task: to build a map that did not exist. Beginning: when there is no data — you create it yourself The client did not have a database of apartments.
There was no accurate information about the number of households. There was no single system — only fragments: cadastre, open registers, census data, satellite images, information from real estate agencies. We collected everything. Each source is like a piece of a puzzle.
And gradually — house by house — we recreated a digital copy of residential development throughout the country. It took months. Hundreds of hours of data processing. A system that understands: this house is panel, that one is brick, and that one is an elite residential complex.
A map that speaks. Imagine: you open a web service. Zoom in on the city. Click on the house — and see: 144 apartments. Average size — 56 m². Built in 1978. Population density within a radius of 500 meters — 12,700 people.
You draw a coverage area — and the service shows: 'There are 8,200 households here. Approximate potential turnover — 180 thousand dollars per month'.
And nearby — red marks. Competitors. Two discounters. One grocery store at home. A small local player.
The one who knows where people live knows where business will work.

Articles on How We Implemented the Project for a Real Estate Agency
Notes on integrations with CRM and automation of object selection for clients.

Hi! I'm Valery, your personal manager. Give me 2 minutes and I'll show you how quickly, reliably and without unnecessary hassle to automate and accelerate your business.